The CPR (Central Pivot Range) Indicator

1. Introduction

The Central Pivot Range (CPR) indicator is a technical analysis tool used by traders to identify key price levels and potential support and resistance zones in the market. It is particularly popular among day traders and short-term traders for its effectiveness in predicting price movements.

2. Understanding the CPR Indicator

Definition

The CPR indicator consists of three main lines: the Pivot Point (P), the Top Central Pivot (TC), and the Bottom Central Pivot (BC). These lines help traders understand market sentiment and potential price action.

Components

  • Pivot Point (P): The central point calculated using the high, low, and close prices of the previous trading session.
  • Top Central Pivot (TC): The upper range of the central pivot, providing a potential resistance level.
  • Bottom Central Pivot (BC): The lower range of the central pivot, providing a potential support level.

3. Calculating the CPR Indicator

Formula

These are derived from the underlying high, low, and close price calculations:

  • Pivot = (High + Low + Close) ÷ 3.
  • Bottom CPR = (High + Low) ÷ 2.
  • Top CPR = (Pivot – BC) + Pivot.


Example Scenario:

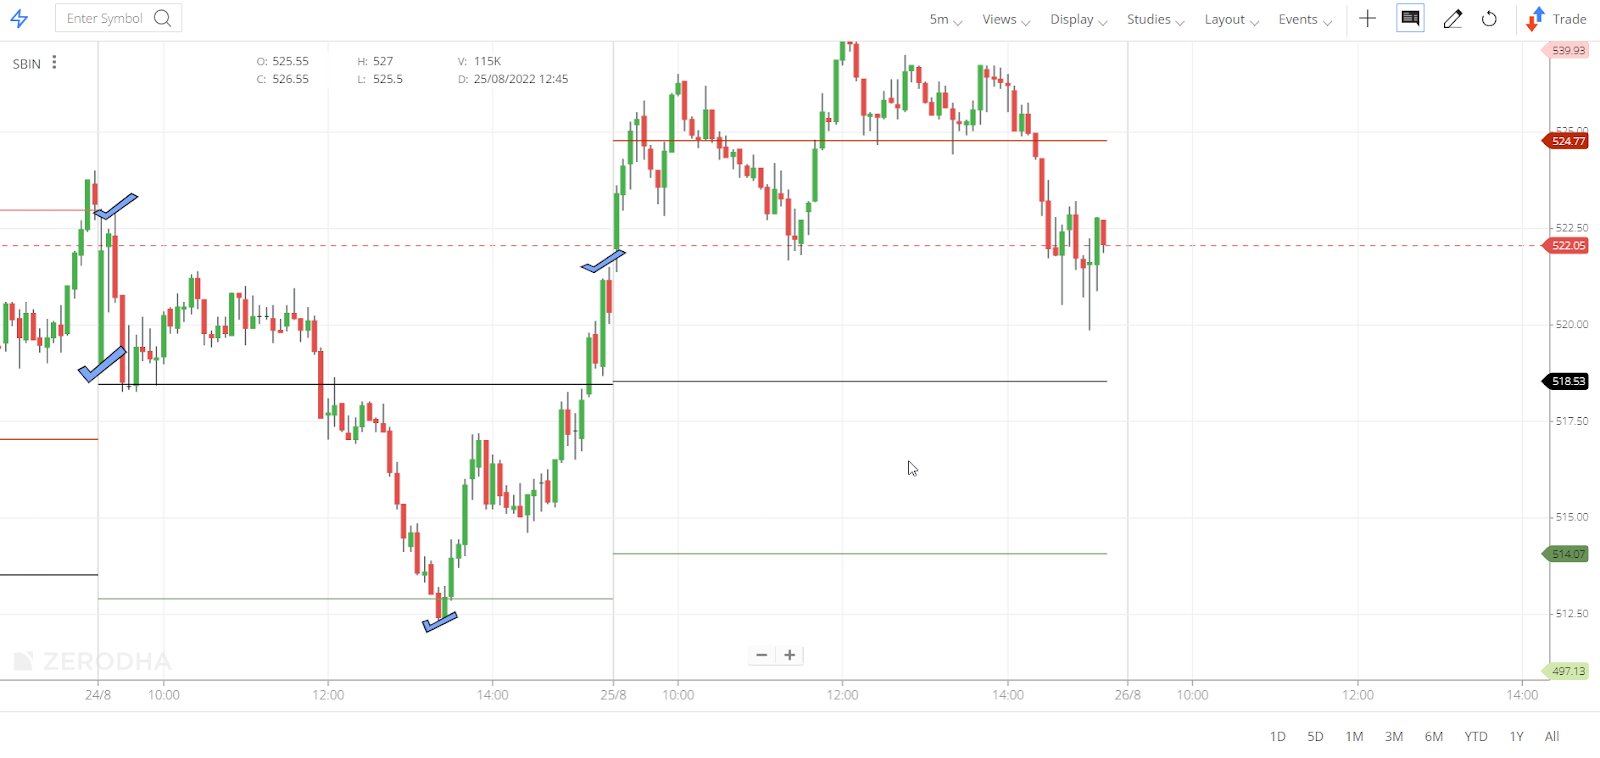
  • The chart of SBIN on 24/08/2022 (the previous day) has it’s Open (O) – 519, High (H) – 523, Low (L) – 512.3, and Close (C) – 519.3.
  • On 25/08/2022, the pivot point data was 518.53. i.e. (H+L+C ÷ 3)
  • Here if the pivot point data is ascertained from the OHLC data of 25/08/2022, it will not match with the pivot points as it is calculated using the previous day’s OHLC.

The formula for calculating pivot points is mentioned below, with an example on Kite ChartIQ.

Assume XYZ’s stock has its High (H) – 129.7, Low (L) – 126.9 and Close (C) – 127.35, respectively. So the pivot points in Kite would be calculated as follows:

KITE(ChartIQ) 
Pivot point = (H + L + C) / 3127.98
First support level (S1) = (2 * P) – H126.27
Second support level (S2) = P – (H – L)125.18
Third support level (S3) = P – 2*(H-L)122.38
First resistance level (R1) = (2 * P) – L129.07
Second resistance level (R2) = P + (H – L)130.78
Third resistance level (R3) = P + 2*(H – L)133.58

Did you know? CPR helps the trader identify key price points and the associated trend around these price points. Today’s CPR values act as the reference for tomorrow’s trading.

4. Interpreting the CPR Indicator

Trading Signals

  • Above CPR: If the price is trading above the CPR, it indicates a bullish sentiment.
  • Below CPR: If the price is trading below the CPR, it indicates a bearish sentiment.
  • CPR Width: A narrow CPR suggests less volatility and potential for a breakout, while a wide CPR indicates higher volatility.

Trend Identification

  • Bullish Trend: Prices consistently above the CPR.
  • Bearish Trend: Prices consistently below the CPR.
  • Sideways Trend: Prices oscillating around the CPR.

5. Strategies Using CPR Indicator

CPR with Other Indicators

Combining the CPR with other technical indicators like moving averages, RSI, or MACD can provide more robust trading signals.


Practical Trading Strategies

  • Breakout Strategy: Entering trades when the price breaks above or below the CPR range.
  • Trend Reversal Strategy: Using the CPR to identify potential reversal points when the price moves significantly away from the central pivot.

6. Advantages and Limitations of the CPR Indicator

Advantages

  • Simplicity: Easy to calculate and interpret.
  • Versatility: Can be used across different timeframes.
  • Effectiveness: Provides clear support and resistance levels.

Limitations

  • Lagging Indicator: Based on past price data, which may not always predict future movements.
  • False Signals: Can sometimes give false breakout or reversal signals.

7. Conclusion

The CPR indicator is a valuable tool for traders looking to identify key price levels and market trends. By combining it with other technical analysis tools, traders can enhance their decision-making process and improve their trading strategies.


8. References

  • Technical Analysis of the Financial Markets by John Murphy
  • Trading for a Living by Dr. Alexander Elder
  • Investopedia: Central Pivot Range (CPR) Indicator
  • How are the pivot points derived by Zerodha
Download this page as pdf

Hope you love it!

Good Luck!

Divvyam Parashar,

Founder & CEO
UPMARKET ACADEMY PRIVATE LIMITED

*Terms and Conditions apply*